
An MTSS meeting usually starts with a stack of exports. One file has the latest interim test. Another has attendance. The gradebook is in a third place, and behavior and SEL notes are somewhere else. Someone has to line them up before the team can talk about a single student.
Thrive already puts attendance, behavior and SEL check-ins into one early-warning picture. Thrive Academics adds the academic side, and it is part of Thrive.
A signal, not a score
Every source becomes a percentile for the student’s grade and season, so a test, a class grade from a connected gradebook, attendance and behavior can sit on one scale. Each night, Thrive compares a student’s growth with students in the same grade and subject who started at the same score, using the test vendor’s growth norms where the file carries them. If growth falls short, the teacher sees a signal.
Signals come in three families: growth that falls short, a test and a class grade that disagree, and a score that looks unreliable or missing. A signal is not a grade or a label. It shows the numbers behind it, so the teacher can check the claim in seconds. It names a likely cause, for example the lowest skill area on the test. It suggests interventions from the district’s own intervention list, and, when the district’s AI features are on, an AI explainer gives a one-sentence summary of the evidence.
The teacher decides what happens next. They can confirm the signal, dismiss it with a reason, snooze it until the next test window, assign it, or start the intervention. A dismissed signal is useful information too, because it tells the team the flag did not match what the teacher sees in class.
Comparing like with like
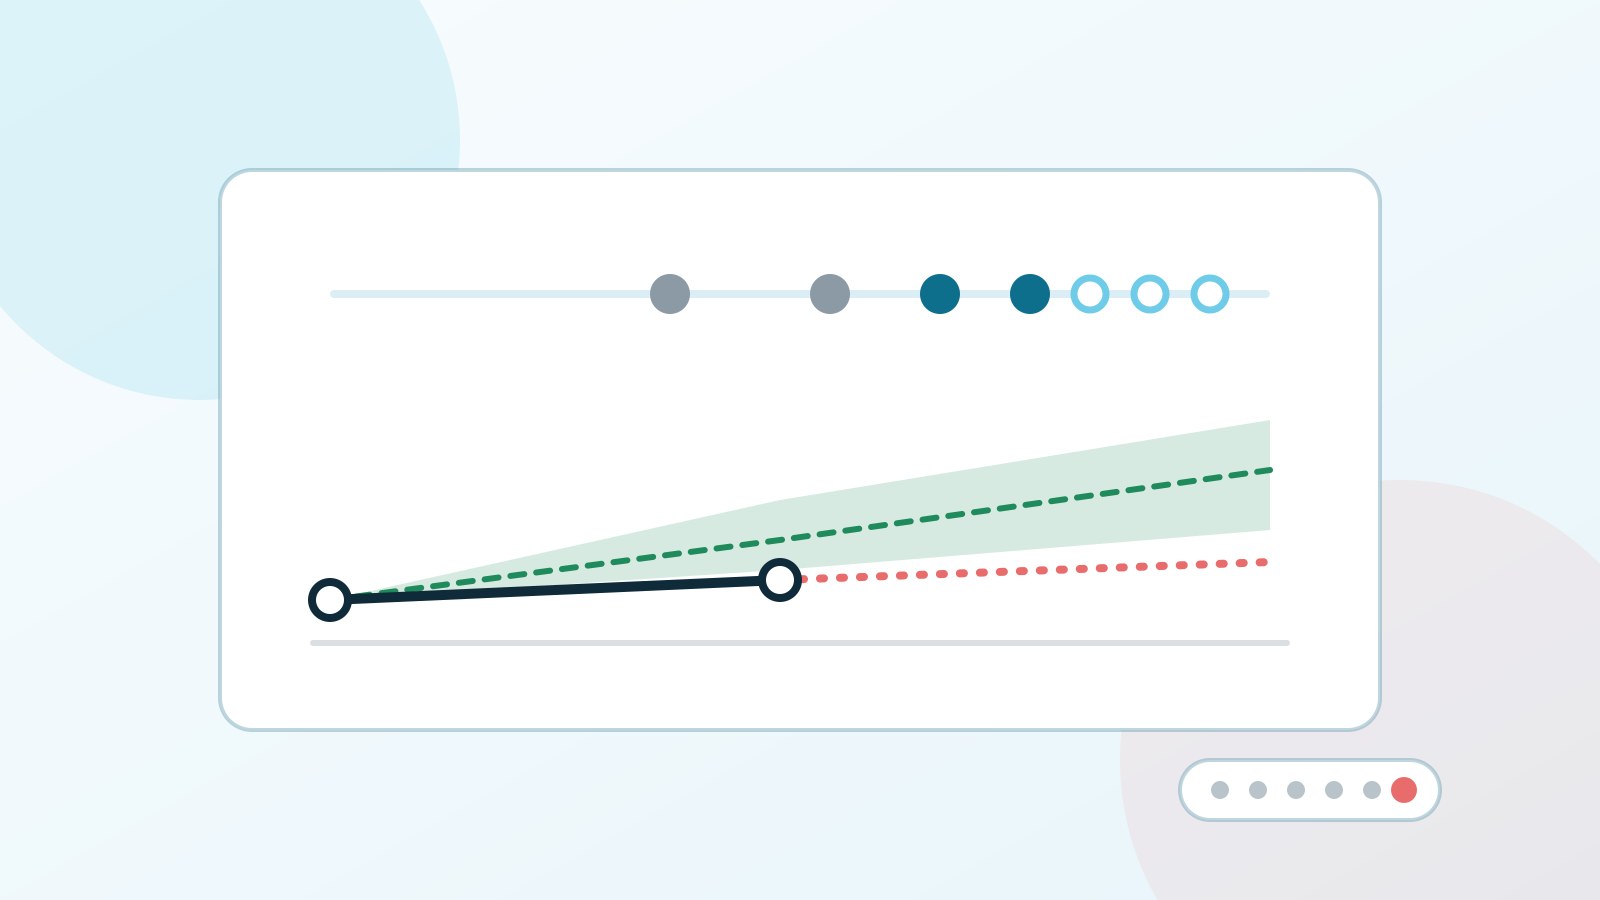
Growth only means something against the right comparison. Thrive Academics compares a student with others who started at the same score, not with the whole grade. The student page shows a growth band, every source on one scale, and a peer view: where this student sits among similar students, as dots with no names.
Some scores should not drive a decision at all. When a test flags a result as unreliable, for example because the student rushed, that result is left out of the other signals until the student retests.
One grid, progress monitoring and tier movement
The MTSS grid has one row per student and one column per source, sorted by need, with open signals in the last column. The count in the badge matches the rows you can see, so nobody has to wonder what is hidden.
Progress monitoring plots weekly probes against a goal line, with a trend and a line for the day each intervention started. Three probes in a row below the line raise a signal for the interventionist who owns the step.
Leaders see tier movement, how students moved between tiers over a term and who moved. Intervention scorecards compare students who received an intervention with similar students who did not. A scorecard shows how many students it rests on, and it fades when there are too few or when the range is inconclusive. It is a guide for the team, not proof.
Families, in their language
A teacher reviews an AI-drafted, plain-language update: what the student does well, the focus, what the school is doing and one thing to try at home. The teacher edits it and approves it, and families see nothing until then. It reaches each family in their own language, they can reply, and the teacher reads the reply in theirs. A shared home goal tracks progress between the teacher and the family.
Fairness and settings
Thrive Academics never uses a student’s demographics to decide who gets flagged. Similar students means the same grade, subject, season and starting score, nothing else. A fairness report each term shows how often each group is flagged. It hides any group under 10 students, and the group that would reveal it. Teachers see only their own students.
Signal health shows the dismissal rate and warns the district when it is high, because the thresholds may be too sensitive. A history import loads two or three prior years of assessment files, so growth bands and trends work from the first term. Districts set defaults and required signals, schools add stricter limits, teachers set goal lines and keep a watch list with snooze, and a preview shows what a change would have flagged.
Next step
The Thrive page has the interactive screens for the student page, progress monitoring, the grid, the leader views, family updates and fairness. A demo call starts with your assessment exports, because the first job is matching their columns to Thrive.